Monitoring Okta Logs for Threat Detection: Step-by-Step Guide

What is Okta?
Okta is a cloud-based Identity Provider (IdP) platform used by thousands of organizations to securely manage workforce authentication, authorization, and access to internal and third-party applications. It acts as a central hub for verifying user identities and enforcing policies such as SSO (Single Sign-On), MFA (Multi-Factor Authentication), and conditional access controls. When employees log into systems like Slack, Salesforce, AWS, or internal tools, they often do so through Okta.
Okta often is the front door to the organization’s most sensitive data and systems. Every authentication attempt, session token issuance, group membership update, or API access passes through Okta and is logged. This makes Okta a mission-critical control point in your security architecture.
Okta supports both workforce identity (employees, contractors, partners) and customer identity (B2C IAM). This guide focuses on workforce identity logs, which are especially relevant for monitoring internal threats and policy enforcement. These logs help answer questions like:
- Who just reset their MFA device at 3:00 AM?
- Why is an engineer suddenly part of the “Super Admins” group?
- Was that API token created in accordance with policy?
- Are users logging in from unexpected geographies?
When threats attempt to compromise accounts or escalate privileges, those actions often show up first in identity logs before an EDR or cloud workload protection system notices anything. That’s why security engineers are increasingly prioritizing Okta log visibility as a foundational part of their detection strategy. It’s not just about access, it’s about accountability, anomaly detection, and rapid response.
What are Okta System Logs?
Okta System Logs are a comprehensive audit trail of identity activity across your entire organization. They capture detailed, structured JSON events for everything from successful and failed login attempts to password resets, group membership changes, API token usage, MFA enrollments, and administrative actions. These logs are accessible via the Okta System Log API (/api/v1/logs) and are available to all Okta customers, including those on enterprise workforce identity plans.
Each event captures a user, app, or admin action with metadata like time, IP, location, user agent, and outcome. The event types are highly specific, making it easier to write precise detection logic or correlation rules downstream. Here’s what a typical event might look like:
{
  "eventId": "02bOXszv7aMpK9fYI0x7",
  "eventType": "user.mfa.factor.reset_all",
  "published": "2025-05-20T21:11:07.948Z",
  "actor": {
    "type": "User",
    "id": "00u1abcd1234",
    "displayName": "alice@example.com"
  },
  "target": [
    {
      "id": "00u1abcd1234",
      "displayName": "alice@example.com",
      "type": "User"
    }
  ],
  "client": {
    "ipAddress": "203.0.113.24",
    "geographicalContext": {
      "country": "US",
      "state": "CA",
      "city": "San Francisco"
    },
    "userAgent": {
      "rawUserAgent": "Chrome/124.0.6367.78",
      "os": "Mac OS X",
      "browser": "CHROME"
    }
  },
  "outcome": {
    "result": "SUCCESS"
  },
  "debugContext": {
    "debugData": {
      "factor": "token:software:totp"
    }
  }
}
There are hundreds of distinct eventType values, grouped into categories like authentication, user management, session activity, app access, and API usage.
For security operations, some of the most valuable include:
- user.authentication.failed and user.authentication.sso for spotting brute-force attempts or anomalous login flows
- user.account.lock and user.mfa.factor.reset_all for detection of account recovery abuse
- system.group.user_membership.add for tracking privilege changes
- application.api.token.create for monitoring long-lived tokens that may be abused for persistence or exfiltration
These logs are structured and consistent, which means they’re easy to normalize, enrich, and query unlike many other SaaS logs that are verbose or inconsistent. Once streamed into a destination like S3 with tools like Grove, and enriched with tools like Substation, they become a powerful source of signal for threat detection platforms like Scanner.dev. Okta system logs provide the visibility you need to secure your organization’s identity layer.
Why monitor Okta logs? MITRE ATT&CK mapping
Okta acts as the primary gateway to nearly every system your users touch. That makes its logs incredibly valuable if not essential for detecting identity-based attacks early. While endpoint detection has long been standard, identity detection is still catching up. Okta system logs fill that gap with rich context: IPs, user agents, MFA status, group changes, token activity, and more. You can spot threats like lateral movement, suspicious logins, and account takeovers before they escalate.
We’ve mapped common Okta log patterns to MITRE ATT&CK tactics and techniques. These examples show how identity activity ties directly to attacker behavior and what to look for in your detection rules or investigations:
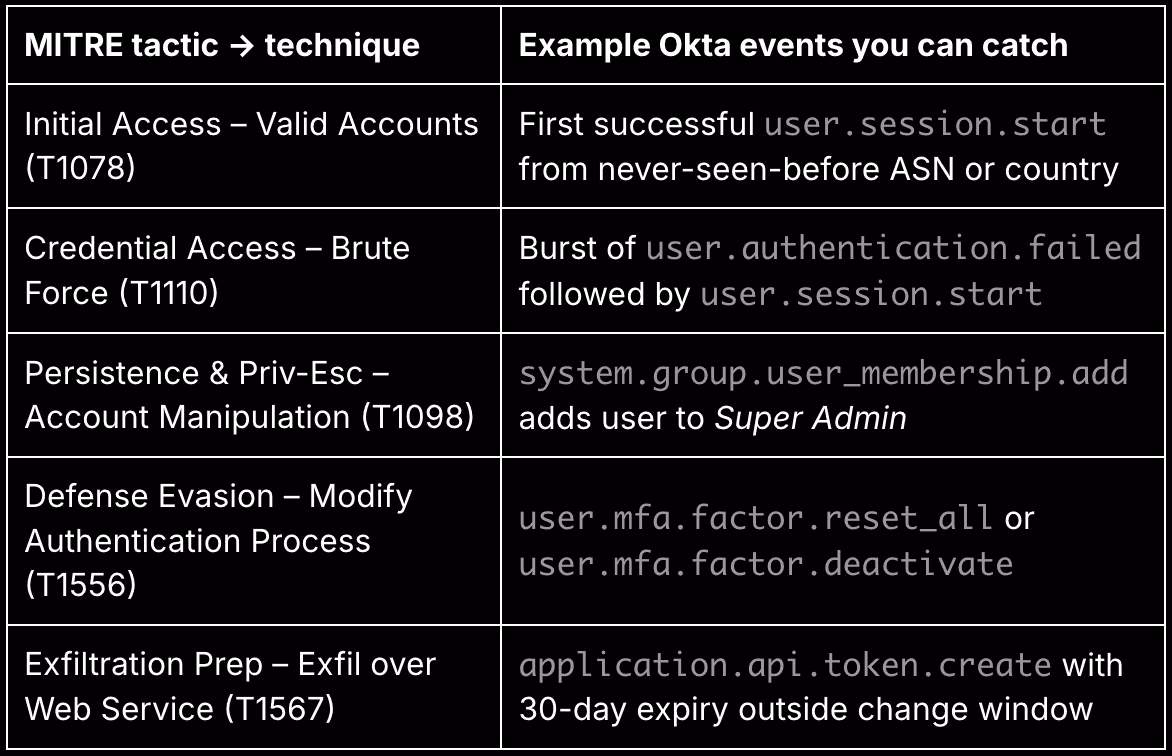
These mappings are just the starting point. For example, grouping by IP address or ASN over time can highlight credential stuffing or impossible travel anomalies. Tracking users who reset MFA for multiple accounts could reveal insider threat behavior. The key is combining Okta’s granular event types with time-based correlations and enriched metadata (like GeoIP or threat intel) to spot signals others might miss.
Okta system logs let you treat identity like any other attack surface with real-time monitoring, historical baselining, and structured detection logic. If your organization is serious about cloud-native security, Okta logs should be one of your first high-fidelity telemetry sources to onboard.
Fetching Okta logs with the API
Okta provides a powerful and well-documented API for accessing its system logs in near-real time. This is the official way to pull logs into your own monitoring pipeline, as Okta does not support direct log forwarding to S3, SIEMs, or third-party destinations. You use the System Log API to continuously poll for new events and export them in structured JSON format.
To collect logs at scale, you’ll need to understand a few key aspects of how the API works:
Pagination and Cursors
The System Log API is paginated, returning up to 1,000 events per request. Each response includes a Link header with a next URL to continue fetching where you left off. You can use this cursor to implement continuous polling without duplication or gaps. The until and since query parameters allow you to define time ranges explicitly, which is useful for backfilling.
Rate Limits
The API supports up to 5,000 requests per hour per API token (and per org). This is more than sufficient for most use cases, even in large enterprises. A polling interval of once every 60 seconds is generally safe and efficient, especially if you cache and resume the cursor between runs.
Authentication and Scoping
To call the API, you’ll need an Okta API token with appropriate permissions. For security and observability use cases, we recommend creating a dedicated service account with the System Log Read Only admin role. This limits the blast radius of the token while allowing full access to all relevant log data.
What You Get
Each log event returned includes:
- eventType (e.g. values like user.authentication.failed, or system.group.user_membership.add)
- actor and target (who did what, and to whom)
- client IP address, user agent, and geo-location
- outcome (success or failure, with reason)
- debugContext and requestId for deeper tracing
This structured data is ideal for downstream enrichment, correlation, and detection. If you’re using tools like Grove and Substation, this API is the entry point to your identity monitoring pipeline.
Up next, see how to use HashiCorp’s open-source tool Grove to automate polling and send events to your S3 bucket.
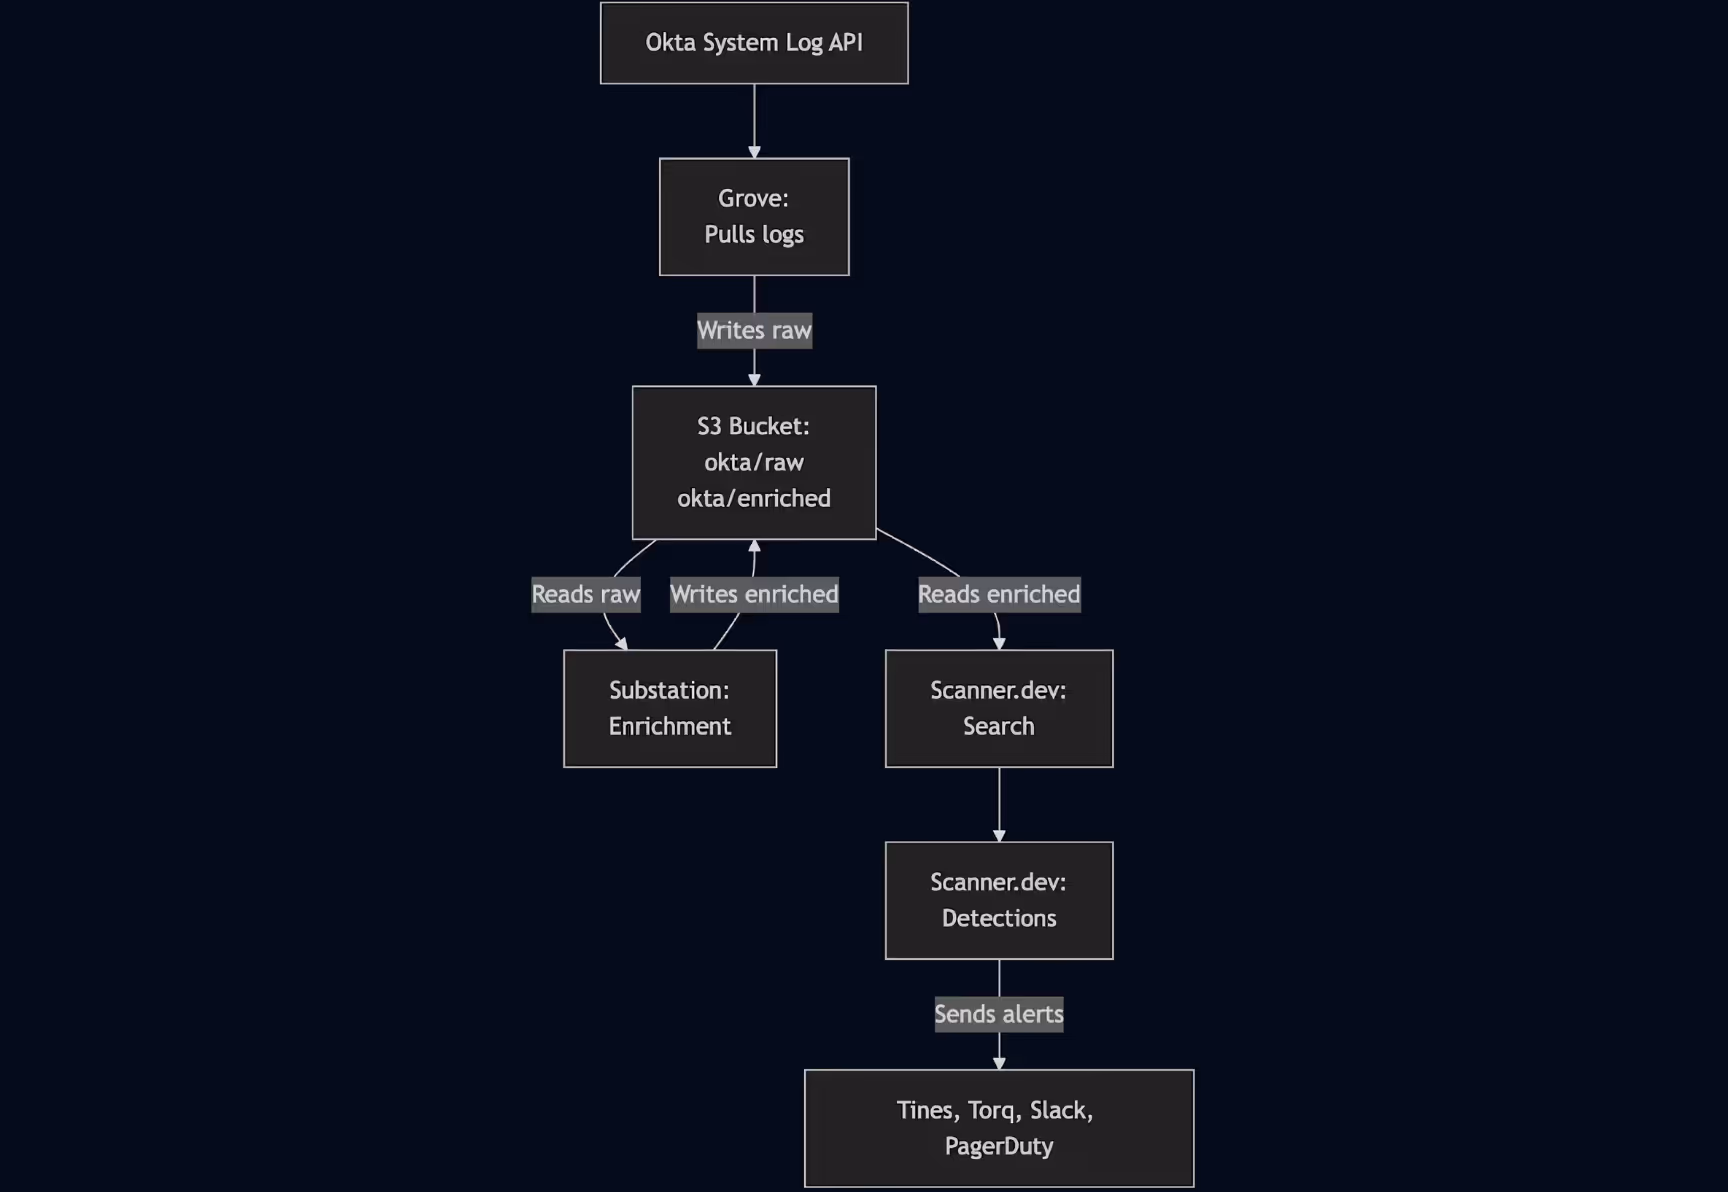
Reference pipeline architecture: Okta → Grove → Substation → Scanner
Once you’ve connected to the Okta System Log API, the next challenge is making that data useful: collecting it reliably, enriching it with context, storing it affordably, and analyzing it in real time. The pipeline we recommend is built entirely on open standards and open-source tools. It’s modular, transparent, and cost-efficient ideal for security teams that want flexibility and full control over their detection infrastructure.
Here’s how it works:
- Grove pulls Okta logs using the System Log API and writes them to your Amazon S3 bucket in gzipped JSON format. It handles pagination, checkpointing, and crash recovery out of the box.
- Substation, an open-source enrichment engine by Brex, reads the raw files from S3, enriches them (GeoIP, ASN, threat intel, and field normalization), and writes them back to S3 under a new prefix.
- Scanner indexes the enriched data directly from S3, enabling both ad hoc search and continuous threat detection with YAML-based rules. When those rules fire, Scanner will send alerts to destinations like Tines, Torq, Slack, and PagerDuty for immediate triage and response.
This architecture ensures your logs are fully under your control, stored in a central data lake, and enriched before analysis all without vendor lock-in.
Each component in this pipeline is independently deployable and modular, so you can scale or replace parts as needed. For example, you might start with Grove and Substation for log collection and enrichment, then later switch to your own custom polling agent or enrichment framework tailored to your environment.
Because Scanner reads directly from S3 and supports structured JSON, it doesn’t require a specific upstream toolset, just well-formed events in a predictable location. You get real-time detection at data lake prices, with full flexibility to adapt the pipeline over time.
Grove: Pulling Okta logs into S3
Grove is an open-source log collection tool from HashiCorp designed to reliably poll SaaS APIs like Okta and write the results directly to object storage. It’s built with reliability in mind, ideal for continuously pulling system logs into an S3-based data lake for long-term storage or downstream processing.
When configured to collect from the Okta System Log API, Grove handles the entire lifecycle of log ingestion:
- It authenticates using an API token you provide.
- It paginates and follows Okta’s next cursors to stream logs continuously.
- It tracks its last read position so it can resume without duplicating or skipping data.
- It writes gzip-compressed JSON lines to S3 in a clean, timestamped folder structure (e.g., okta/raw/YYYY/MM/DD/).
Deploying Grove to AWS with ECS + Fargate using Terraform
To run Grove continuously in AWS, HashiCorp provides an official Terraform deployment template that provisions everything you need to schedule Grove as a recurring task using Amazon ECS Fargate. This setup eliminates the need to manage your own infrastructure and ensures Grove runs on a reliable, serverless compute platform.
Prerequisites
- Terraform installed (>=1.0)
- Docker installed
- AWS CLI installed and authenticated with a user that has permissions to deploy ECS services, IAM roles, and ECR repositories
Step-by-step deployment
1. Clone the Grove repository and switch to the deployment template directory:
git clone https://github.com/hashicorp-forge/grove.git
cd grove/templates/deployment/terraform-aws-ecs
2. Initialize Terraform and plan the deployment:
This will create:
- An S3 bucket for log output
- An ECS Fargate task definition to run Grove
- A CloudWatch Events rule (or EventBridge) to run the task every 10 minutes
terraform init
terraform plan
terraform apply
You’ll be prompted to name your destination S3 bucket (e.g., my-org-okta-system-logs). Terraform will then provision all required AWS infrastructure.
3. Note the ECR repository URL in the Terraform output.
This is where you’ll push the Grove container image.
Build and publish the Grove Docker image
1. Build the image from the root of the Grove repo:
docker image build -t grove:latest .2. Tag and push to your new ECR repository:
aws ecr get-login-password --region us-west-2 | docker login --username AWS --password-stdin <your_account_id>.dkr.ecr.us-west-2.amazonaws.com
docker tag grove:latest <your_ecr_repo_url>:latest
docker push <your_ecr_repo_url>:latest
3. Once the image is pushed, ECS will automatically run the Grove container every 10 minutes.
Customize your Grove configuration
Place your Okta source + S3 destination config in JSON format under the connectors/ directory before deploying. For example:
{
  "source": {
    "type": "okta",
    "name": "prod",
    "config": {
      "org": "https://yourcompany.okta.com",
      "api_token": "${env:OKTA_API_TOKEN}",
      "poll": "60s"
    }
  },
  "destination": {
    "type": "s3",
    "name": "raw_okta",
    "config": {
      "bucket": "my-org-okta-system-logs",
      "path_prefix": "okta/raw/%Y/%m/%d/",
      "compression": "gzip",
      "aws_region": "us-west-2"
    }
  }
}
See an example in Grove’s official GitHub templates for Okta.
This ECS + Fargate approach is ideal for teams who want to automate Okta log collection without provisioning EC2 instances or running agents manually. Once running, your logs will stream into S3 in near real time ready for enrichment via Substation and search/detection with Scanner.
Substation: Enriching Okta logs
Once raw Okta logs are in your S3 bucket, the next step is to enrich them with context that makes detection and investigation more powerful. That’s where Substation comes in. Substation is an open-source log enrichment engine designed for high-scale, declarative pipelines that process logs directly in object storage (like S3).
Substation reads your raw Okta logs (written by Grove to something like okta/raw/), applies enrichment steps, and writes the enhanced results back to the same bucket under a different prefix (e.g., okta/enriched/). Each step is configured via a YAML file, and with each you can easily add, remove, or re-order enrichment stages without writing any code.
Key-value store enrichments
Substation supports local and remote key-value (KV) lookups, which allow you to join contextual data onto your logs. For example, you can:
- Join against a CSV or JSON file that maps IPs or user IDs to labels like “contractor” or “VIP account.”
- Use MaxMind .mmdb files for GeoIP or ASN lookups.
- Load custom threat intelligence indicators for things like known bad IPs or actor fingerprints.
- Cache remote data with automatic TTL for freshness and speed.
Example – ASN enrichment:
This example configures Substation to enrich Okta logs with ASN (Autonomous System Number) information by performing lookups against a MaxMind .mmdb database using the client.ipAddress field.
local sub = std.extVar('sub');

// File with ASN (Autonomous System Number) information for IP addresses
local asn = sub.kv_store.mmdb({
  file: 'https://my.mmdb.example.com/GeoLite2-ASN.mmdb'
});

{
  transforms: [
    sub.tf.enrich.kv_store.item.get({
      object: {
        // Source: the client IP address in the Okta System Logs
        source_key: 'client.ipAddress',
        // Target: logs now enriched with the ASN of the client IP address
        target_key: 'enriched.client.ipAddress.asn'
      },
      kv_store: asn
    }),
    // Send results to the S3 bucket, prefix "okta/enriched"
    sub.transform.send.aws.s3({
      aws: { arn: 'arn:aws:s3:::my-org-okta-system-logs' },
      file_path: { prefix: 'okta/enriched' },
    })
  ],
}
ASN data identifies the network or internet service provider that owns a given IP address, which is useful for detecting suspicious patterns such as logins from hosting providers, unexpected regions, or anomalous ISPs.
By attaching ASN context to each log event, you can build more accurate detections, filter known benign networks, and highlight connections from infrastructure commonly associated with attackers like cloud VPS hosts or anonymizing proxies.
The enriched logs are then written to an S3 bucket under the okta/enriched prefix, ready for indexing and analysis.
Configuring Substation to deploy to AWS
Substation provides a comprehensive Terraform module suite for deploying its enrichment pipelines to AWS using managed services like Lambda, API Gateway, S3, and SQS. These modules give you fine-grained control over how Substation nodes are deployed and connected, while still keeping infrastructure-as-code clean and reusable.
Using S3 + SNS Notifications to Trigger Substation Enrichment
To automate your Okta log processing, you can configure Substation to react to new log files landing in S3 under the okta/raw/ prefix. This is done by enabling S3 Event Notifications to send messages to SNS, which then fan out to a Lambda-based Substation node responsible for enrichment.
Here’s how it works:
High-level architecture
- Grove writes Okta logs to s3://my-org-okta-system-logs/okta/raw/.
- S3 is configured to emit an SNS notification every time a new object is created in that prefix.
- Substation deploys a Lambda function (a node) subscribed to that SNS topic.
- Each time a file arrives, the SNS trigger invokes the Lambda, which reads the object, enriches it, and writes to okta/enriched/.
Terraform setup overview
Here’s how to wire this together in Terraform using Substation’s modules:
1. Create the SNS topic and subscribe Substation’s Lambda:
module "sns" {
  source = "build/terraform/aws/sns"
  config = {
    name = "substation-okta-ingest"
  }
  access = [module.enrich_node.role.name]
}
2. Create the Substation enrichment node (Lambda):
module "enrich_node" {
  source    = "build/terraform/aws/lambda"
  appconfig = module.appconfig
  config = {
    name        = "okta-enrich"
    image_uri   = "${module.ecr.url}:v2.0.0"
    image_arm   = true
    env = {
      "SUBSTATION_CONFIG": "http://localhost:2772/applications/substation/environments/prod/configurations/enrich"
      "SUBSTATION_LAMBDA_HANDLER": "AWS_S3_SNS"
      "SUBSTATION_DEBUG": true
    }
  }
}
3. Configure S3 to publish notifications to SNS for a specific prefix:
This part cannot be fully automated in Terraform unless you manage the bucket directly in your config. But conceptually (and in CloudFormation or the AWS CLI), you would do:
{
  "TopicConfigurations": [
    {
      "TopicArn": "arn:aws:sns:us-west-2:123456789012:substation-okta-ingest",
      "Events": ["s3:ObjectCreated:*"],
      "Filter": {
        "Key": {
          "FilterRules": [
            {
              "Name": "prefix",
              "Value": "okta/raw/"
            }
          ]
        }
      }
    }
  ]
}
This tells S3 to publish an event to SNS every time a new object is added to the okta/raw/ folder.
Why this pattern is useful
- It avoids polling or scheduling, so Substation only runs when there’s work for it to do.
- It scales naturally with the volume of logs from Grove.
- You maintain a real-time, event-driven enrichment pipeline entirely on serverless infrastructure.
Once deployed, your logs flow from Grove → S3 → Substation (via SNS trigger) → S3 enriched.
This Terraform setup deploys Substation as a serverless enrichment engine: it reads from S3, enriches logs with declarative pipelines, and writes back to your data lake and is scalable and cost-efficient via AWS Lambda.
For full details and module options, refer to the Substation AWS Terraform README.
Scanner: Indexing enriched Okta logs
Once your logs have been enriched and written to S3 under the okta/enriched/ prefix, Scanner can be set up to index the logs directly there. It will provide fast, full-text search and live detections on the data.
Unlike traditional SQL engines built for structured data, Scanner is designed to handle unstructured or semi-structured logs like the messy, nested JSON that comes out of Okta and other SaaS tools.
How Scanner indexing works
Scanner uses an inverted index to tokenize your logs and map each unique token to the set of documents (log lines) where it appears. This is the same core concept that powers search engines like Elasticsearch and Lucene. The difference is that Scanner builds and stores its indexes in your own S3 bucket, optimized for batch reads/writes at petabyte scale.
Compared to engines like Presto or Trino (which scan raw data using SQL), Scanner excels at “needle-in-a-haystack” searches over massive log volumes. It doesn’t scan entire files; it uses tokenized indexes to jump directly to matching events. This makes it faster and cheaper: queries that cost $200+ and take hours in Athena might run in seconds on Scanner, at tens of cents per query. That shift turns investigations from a once-a-week event into a continuous, interactive workflow.
Setting up Scanner Indexing via Infrastructure as Code
Scanner can integrate into your AWS environment using Infrastructure as Code (IaC). By using Terraform (or CloudFormation / Pulumi), you can securely set up Scanner’s indexing pipeline. Scanner provides a Terraform template to simplify setup, and all operations take place in your AWS account Scanner never stores your logs or index data itself.
To allow Scanner to index your logs, you’ll need to create an IAM role in your AWS account that Scanner can assume. This is a secure cross-account setup that gives Scanner scoped credentials.
In Scanner, visit Settings > AWS Accounts > Link New Account, and follow the setup workflow there. You will have the option to run setup via IaC (recommended), or in the AWS Console UI via CloudShell.
The steps are outlined in the “Linking AWS Accounts” section in the Scanner documentation. Here is what you will do:
- Create a new S3 bucket to store Scanner’s index files.
- Create a role with a trust policy that allows the Scanner AWS account to assume it.
- Create a policy on that role to give:
- Read permission to the S3 buckets containing your logs. From our example, this would just be the single bucket named my-org-okta-system-logs.
- Read/write permissions to the new S3 bucket for Scanner index files.
- Create a new SNS topic to receive s3:ObjectCreated notifications from the S3 buckets containing your logs.
- This is how Scanner learns that there are new logs to add to the index.
Creating an S3 import rule
Set up a Scanner Import Rule to define how log files are ingested and transformed:
- Go to Settings → Import Rules → Create New Rule
- Choose:
- Source bucket: my-org-okta-system-logs
- Prefix: okta/enriched/
- File format: JSON Lines
- Compression: GZIPSource type: okta:system
- Under Transformations, choose ECS Normalization – Okta Logs. This will add Elastic Common Schema (ECS) fields to each log event, nested under @ecs.
Example of transformed Okta System log event with ECS fields
Here’s a snippet of what the output might look like:
{
    "@ecs": {
        "event": {
            "action": "user.mfa.factor.reset_all",
            "outcome": "success"
        },
        "source": {
            "geo": {
                "city_name": "San Francisco",
                "country_name": "US",
                "region_name": "CA"
            },
            "ip": "203.0.113.24"
        },
        "user": {
            "email": "alice@example.com",
            "id": "00u1abcd1234",
            "name": "alice@example.com",
            "type": "User"
        },
    },
    "actor": {
        "displayName": "alice@example.com",
        "id": "00u1abcd1234",
        "alternateId": "alice@example.com",
        "type": "User"
    },
    "client": {
        "geographicalContext": {
            "city": "San Francisco",
            "country": "US",
            "state": "CA"
        },
        "ipAddress": "203.0.113.24",
        "userAgent": {
            "browser": "CHROME",
            "os": "Mac OS X",
            "rawUserAgent": "Chrome/124.0.6367.78"
        }
    },
    "debugContext": {
        "debugData": {
            "factor": "token:software:totp"
        }
    },
    "eventId": "02bOXszv7aMpK9fYI0x7",
    "eventType": "user.mfa.factor.reset_all",
    "outcome": {
        "result": "SUCCESS"
    },
    "published": "2025-05-20T21:11:07.948Z",
    "target": [
        {
            "displayName": "alice@example.com",
            "id": "00u1abcd1234",
            "type": "User"
        }
    ]
}
The @ecs object standardizes key fields across all your log sources, which is useful for writing generic detection rules, correlating activity, and joining datasets. Scanner also preserves the original structure of your logs, so you can always fall back to raw fields when needed.
Once indexing is live, new logs that land in okta/enriched/ will be automatically parsed, normalized, and indexed for fast search and detection. You’ll be able to search logs in seconds, write detection rules that run every minute, and surface threats before they escalate.
Scanner: Example search queries for Okta
Once your Okta logs are flowing into Scanner and indexed with ECS fields, the Search tab becomes your investigative command center. Scanner allows you to write powerful, full-text queries combined with aggregation and filtering logic, perfect for uncovering identity-based threats like account compromise, brute-force attacks, or policy evasion.
Filtering to just Okta logs
To scope your query to only Okta logs, prepend every query with the following:
%ingest.source_type='okta:system'This ensures you’re only analyzing events coming from the Okta System Log source.
Query 1: Same user logging in from multiple countries
This query helps identify accounts that have successfully logged in from two or more countries in a short time window, often a red flag for credential compromise.
Steps:
- In the Search tab, set the time range to the last 6 hours
- Run this query:
%ingest.source_type='okta:system'
@ecs.event.action='user.session.start'
@ecs.event.outcome='success'
| stats
  min(@scnr.datetime) as first_time,
  max(@scnr.datetime) as last_time,
  countdistinct(@ecs.source.geo.country_name) as num_distinct_countries
  by @ecs.user.email
| where num_distinct_countries > 1
This highlights users who appear to be accessing from multiple locations in a suspiciously short timeframe an early sign of account takeover.
Query 2: Password spray attempts
Password spray is a technique where an attacker tries a few common passwords across many user accounts from a single IP. This query catches it.
Steps:
- Set the time range to the last 1 hour, 24 hours, or even a week
- Run:
%ingest.source_type='okta:system'
@ecs.event.action='user.session.start'
@ecs.event.outcome='failure'
outcome.reason: ("VERIFICATION_ERROR" "INVALID_CREDENTIALS")
| stats
  min(@scnr.datetime) as first_time,
  max(@scnr.datetime) as last_time,
  countdistinct(@ecs.user.email) as num_distinct_users_attempted,
  count() as num_attempts
  by @ecs.source.ip, @ecs.source.geo.city_name, @ecs.source.geo.country_name
| where num_distinct_users_attempted > 15
This helps you identify IPs attempting login failures across many accounts, a classic sign of automated password attacks.
Query 3: FastPass phishing protection in action
Okta FastPass is a phishing-resistant authentication mechanism. This query surfaces where FastPass detected and stopped a phishing login attempt.
Steps:
- Run this query over the last few days or weeks:
%ingest.source_type='okta:system'
@ecs.event.action='user.authentication.auth_via_mfa'
@ecs.event.outcome='failure'
outcome.reason: 'FastPass declined phishing attempt'
| stats
  min(@scnr.datetime) as first_time,
  max(@scnr.datetime) as last_time
  by
  @ecs.user.email,
  @ecs.source.ip,
  @ecs.source.geo.city_name,
  @ecs.source.geo.country_name,
  @ecs.event.action,
This query highlights real-world security wins, where Okta’s phishing protections blocked an attempted breach. It’s also a great way to demonstrate the effectiveness of your identity protection investments.
But beyond just surfacing the blocked attempt, the results of this query provide excellent starting points for deeper investigation. For example, if you identify a suspicious IP address or user email in the output, you can pivot directly within Scanner to explore all activity associated with that entity across all indexed log sources, not just Okta. That includes AWS CloudTrail, application logs, endpoint telemetry, and more.
To do this, simply run a follow-up query using:
@ecs.source.ip="<suspicious_ip_here>" or
@ecs.user.email="<suspicious_email_here>"
These let you quickly trace whether the same IP was involved in suspicious AWS actions, unusual API activity, or failed logins in other systems. With Scanner’s unified index and ECS-normalized fields, you’re not limited to siloed searches; you get a holistic, organization-wide view of actor behavior in seconds.
These are just a few examples of the kind of deep, high-speed investigation you can run once your Okta logs are normalized, enriched, and indexed in Scanner. Because Scanner uses a highly optimized inverted index and runs directly on S3, you can run dozens of these queries every day at interactive speed without blowing your budget or waiting for hours-long queries to finish in other tools.
Scanner: Threat detections for Okta
Scanner is also a detection platform that runs queries continuously.
Scanner’s detection engine treats every detection rule as a query, the exact same kind you’d write in the Search UI. If you can search for it, you can detect it. Whether it’s failed logins, privilege escalations, or unusual MFA activity, you can codify your detection logic using the same queries you use during investigations.
How Scanner’s detection engine works
When new logs arrive in your S3 bucket, Scanner’s indexers parse and tokenize the data. At the same time, Scanner runs a state machine across all active detection rules. This allows Scanner to evaluate all detection queries simultaneously in a single pass over the log data dramatically reducing compute overhead.
Each query is executed up to the first aggregation step (stats, groupbycount, etc). Everything before that – filters, transforms, field mapping – is run once during indexing. The output is cached in a highly efficient roll-up tree stored in S3, which takes up less than 1% of the original data size.
Once per minute, Scanner runs your detection rules across this roll-up tree for varying time ranges (e.g., 5 minutes, 1 hour, 24 hours). Because the roll-up structure is optimized for fast, windowed queries, you get minute-by-minute detection over wide time spans.
This means you can write powerful detection logic, run it frequently, and not worry about overloading your system or your budget.
Managing detections as code (YAML + GitHub sync)
Scanner supports detections-as-code, so you can write your detection rules in YAML, commit them to GitHub, and Scanner will automatically sync and apply them. This gives you version control, testing, and peer review.
You can define unit tests that validate your rule logic using sample events, ensuring rules behave as expected before deploying to production.
Here’s a complete example in YAML format:
name: Okta - Password Spray Attempt by IP
description: |
  Detects possible password spray attacks by identifying IP addresses that attempt to log in
  to a large number of distinct user accounts with invalid credentials.

  This rule watches for failed Okta login attempts (`event.action='user.session.start'` with
  `event.outcome='failure'`) where the failure reason is either `VERIFICATION_ERROR` or
  `INVALID_CREDENTIALS`. These are typical indicators of an attacker trying common passwords
  across many accounts from a single IP address.

  The threshold in this rule is set to more than 15 distinct user email attempts from a
  single IP within a 1-hour window. You can adjust this number based on your organization's
  tolerance and baseline login activity.

  Triggers an alert every minute when the pattern is detected. Alerts can be routed to
  any configured sink (e.g., Slack, PagerDuty, SOAR platform) using `event_sink_keys`.
severity: Medium
query_text: |
  %ingest.source_type='okta:system'
  @ecs.event.action='user.session.start'
  @ecs.event.outcome='failure'
  outcome.reason: ("VERIFICATION_ERROR" "INVALID_CREDENTIALS")
  | stats
    countdistinct(@ecs.user.email) as attempted_users,
    count() as failures
    by @ecs.source.ip
  | where attempted_users > 15
time_range_s: 3600
run_frequency_s: 60
event_sink_keys:
  - medium_severity_alerts
tags:
  - tactics.ta0006.credential_access
  - techniques.t1110.brute_force
tests:
  - name: Test alert is triggered for >15 distinct failed login attempts from same IP
    now_timestamp: "2025-05-21T12:00:00Z"
    dataset_inline: |
      {"@scnr.datetime": "2025-05-21T11:55:00Z", "%ingest.source_type": "okta:system", "@ecs": {"event": {"action": "user.session.start", "outcome": "failure"}, "user": {"email": "user1@example.com"}, "source": {"ip": "203.0.113.10"}}, "outcome": {"reason": "INVALID_CREDENTIALS"}}
      {"@scnr.datetime": "2025-05-21T11:55:05Z", "%ingest.source_type": "okta:system", "@ecs": {"event": {"action": "user.session.start", "outcome": "failure"}, "user": {"email": "user2@example.com"}, "source": {"ip": "203.0.113.10"}}, "outcome": {"reason": "INVALID_CREDENTIALS"}}
      {"@scnr.datetime": "2025-05-21T11:55:10Z", "%ingest.source_type": "okta:system", "@ecs": {"event": {"action": "user.session.start", "outcome": "failure"}, "user": {"email": "user3@example.com"}, "source": {"ip": "203.0.113.10"}}, "outcome": {"reason": "INVALID_CREDENTIALS"}}
      {"@scnr.datetime": "2025-05-21T11:55:15Z", "%ingest.source_type": "okta:system", "@ecs": {"event": {"action": "user.session.start", "outcome": "failure"}, "user": {"email": "user4@example.com"}, "source": {"ip": "203.0.113.10"}}, "outcome": {"reason": "INVALID_CREDENTIALS"}}
      {"@scnr.datetime": "2025-05-21T11:55:20Z", "%ingest.source_type": "okta:system", "@ecs": {"event": {"action": "user.session.start", "outcome": "failure"}, "user": {"email": "user5@example.com"}, "source": {"ip": "203.0.113.10"}}, "outcome": {"reason": "INVALID_CREDENTIALS"}}
      {"@scnr.datetime": "2025-05-21T11:55:25Z", "%ingest.source_type": "okta:system", "@ecs": {"event": {"action": "user.session.start", "outcome": "failure"}, "user": {"email": "user6@example.com"}, "source": {"ip": "203.0.113.10"}}, "outcome": {"reason": "INVALID_CREDENTIALS"}}
      {"@scnr.datetime": "2025-05-21T11:55:30Z", "%ingest.source_type": "okta:system", "@ecs": {"event": {"action": "user.session.start", "outcome": "failure"}, "user": {"email": "user7@example.com"}, "source": {"ip": "203.0.113.10"}}, "outcome": {"reason": "INVALID_CREDENTIALS"}}
      {"@scnr.datetime": "2025-05-21T11:55:35Z", "%ingest.source_type": "okta:system", "@ecs": {"event": {"action": "user.session.start", "outcome": "failure"}, "user": {"email": "user8@example.com"}, "source": {"ip": "203.0.113.10"}}, "outcome": {"reason": "INVALID_CREDENTIALS"}}
      {"@scnr.datetime": "2025-05-21T11:55:40Z", "%ingest.source_type": "okta:system", "@ecs": {"event": {"action": "user.session.start", "outcome": "failure"}, "user": {"email": "user9@example.com"}, "source": {"ip": "203.0.113.10"}}, "outcome": {"reason": "INVALID_CREDENTIALS"}}
      {"@scnr.datetime": "2025-05-21T11:55:45Z", "%ingest.source_type": "okta:system", "@ecs": {"event": {"action": "user.session.start", "outcome": "failure"}, "user": {"email": "user10@example.com"}, "source": {"ip": "203.0.113.10"}}, "outcome": {"reason": "INVALID_CREDENTIALS"}}
      {"@scnr.datetime": "2025-05-21T11:55:50Z", "%ingest.source_type": "okta:system", "@ecs": {"event": {"action": "user.session.start", "outcome": "failure"}, "user": {"email": "user11@example.com"}, "source": {"ip": "203.0.113.10"}}, "outcome": {"reason": "INVALID_CREDENTIALS"}}
      {"@scnr.datetime": "2025-05-21T11:55:55Z", "%ingest.source_type": "okta:system", "@ecs": {"event": {"action": "user.session.start", "outcome": "failure"}, "user": {"email": "user12@example.com"}, "source": {"ip": "203.0.113.10"}}, "outcome": {"reason": "INVALID_CREDENTIALS"}}
      {"@scnr.datetime": "2025-05-21T11:56:00Z", "%ingest.source_type": "okta:system", "@ecs": {"event": {"action": "user.session.start", "outcome": "failure"}, "user": {"email": "user13@example.com"}, "source": {"ip": "203.0.113.10"}}, "outcome": {"reason": "INVALID_CREDENTIALS"}}
      {"@scnr.datetime": "2025-05-21T11:56:05Z", "%ingest.source_type": "okta:system", "@ecs": {"event": {"action": "user.session.start", "outcome": "failure"}, "user": {"email": "user14@example.com"}, "source": {"ip": "203.0.113.10"}}, "outcome": {"reason": "INVALID_CREDENTIALS"}}
      {"@scnr.datetime": "2025-05-21T11:56:10Z", "%ingest.source_type": "okta:system", "@ecs": {"event": {"action": "user.session.start", "outcome": "failure"}, "user": {"email": "user15@example.com"}, "source": {"ip": "203.0.113.10"}}, "outcome": {"reason": "INVALID_CREDENTIALS"}}
      {"@scnr.datetime": "2025-05-21T11:56:15Z", "%ingest.source_type": "okta:system", "@ecs": {"event": {"action": "user.session.start", "outcome": "failure"}, "user": {"email": "user16@example.com"}, "source": {"ip": "203.0.113.10"}}, "outcome": {"reason": "INVALID_CREDENTIALS"}}
    expected_detection_result: true
  - name: Test alert is not triggered for 5 attempts
    now_timestamp: "2025-05-21T12:00:00Z"
    dataset_inline: |
      {"@scnr.datetime": "2025-05-21T11:58:00Z", "%ingest.source_type": "okta:system", "@ecs.event.action": "user.session.start", "@ecs.event.outcome": "failure", "outcome.reason": "INVALID_CREDENTIALS", "@ecs.user.email": "user1@example.com", "@ecs.source.ip": "198.51.100.10"}
      {"@scnr.datetime": "2025-05-21T11:58:10Z", "%ingest.source_type": "okta:system", "@ecs.event.action": "user.session.start", "@ecs.event.outcome": "failure", "outcome.reason": "INVALID_CREDENTIALS", "@ecs.user.email": "user2@example.com", "@ecs.source.ip": "198.51.100.10"}
      {"@scnr.datetime": "2025-05-21T11:58:20Z", "%ingest.source_type": "okta:system", "@ecs.event.action": "user.session.start", "@ecs.event.outcome": "failure", "outcome.reason": "INVALID_CREDENTIALS", "@ecs.user.email": "user3@example.com", "@ecs.source.ip": "198.51.100.10"}
      {"@scnr.datetime": "2025-05-21T11:58:30Z", "%ingest.source_type": "okta:system", "@ecs.event.action": "user.session.start", "@ecs.event.outcome": "failure", "outcome.reason": "INVALID_CREDENTIALS", "@ecs.user.email": "user4@example.com", "@ecs.source.ip": "198.51.100.10"}
      {"@scnr.datetime": "2025-05-21T11:58:40Z", "%ingest.source_type": "okta:system", "@ecs.event.action": "user.session.start", "@ecs.event.outcome": "failure", "outcome.reason": "INVALID_CREDENTIALS", "@ecs.user.email": "user5@example.com", "@ecs.source.ip": "198.51.100.10"}
    expected_detection_result: false
Create a Rule in the UI (YAML Optional, Fast Always)
You can also create detection rules directly in the Scanner UI using the same YAML format you use in code just without the tests section.
To do this:
- Navigate to Detections → New → Create New Rule in the Scanner UI.
- Paste the fields from your YAML rule one-by-one into the editor (excluding the tests: section).
- Click Save to deploy the rule.
This UI-based workflow is great for rapid prototyping. A typical flow might look like this: first, run exploratory searches in the Scanner Search tab to refine your detection logic. Once it looks promising, create a new detection rule in the UI and configure it to send alerts to a “staging” event sink such as a Slack channel or webhook endpoint used for testing. This lets you observe how noisy or precise the rule is without flooding your production alerting systems. Once you’re confident in its accuracy and value, you can promote the rule to your GitHub repository to lock it in for production, fully versioned and test-covered alongside your other rules.
Getting started with GitHub detection sync
Scanner supports a GitOps-style workflow for detection engineering, where detection rules are stored, reviewed, and deployed from your own GitHub repository. This lets you manage rules the same way you manage software through version control, pull requests, peer reviews, CI testing, and automated deployment.
- Create a GitHub repository (public or private) with a directory structure like this:
/rules
├── okta-password-spray.yaml
├── okta-fastpass.yaml
└── cloudtrail-priv-esc.yaml- Each file should follow Scanner’s detection rule schema (like the YAML shown above). Include optional tests to validate your rule logic with real or synthetic data.
- In the Scanner UI:
- Navigate to Detection Rules > GitHub > Manage Settings
- Click “Add Repository”
- Paste the name of the repo, eg. my-org/scanner-detections
- Choose the branch to deploy, eg. main
- Under Event Sinks, assign the event sink keys to your real event sinks, like Slack, PagerDuty, Tines, Torq, etc.
Once connected, Scanner will begin ingesting and compiling your rules on each sync.
New commits to the deployment branch will only sync if all rules pass validation and all tests pass.
Using the Scanner CLI to test and validate rules
The Scanner CLI is a Python-based command-line tool that helps you validate and run tests on your detection rules locally before syncing them to Scanner. It’s designed for teams managing detection rules as code, and provides a fast feedback loop during development.
Install the Scanner CLI via pip:
pip install scanner-cliTo authenticate, you’ll need:
- Your Scanner API URL
- An API key (generate this in Scanner under Settings → API Keys)
You can provide these either via environment variables:
export SCANNER_API_URL=https://your-instance.scanner.dev
export SCANNER_API_KEY=your-api-key
Or pass them directly as CLI arguments:
scanner-cli validate -f detections/rule.yaml \textbackslash{}
--api-url=https://your-instance.scanner.dev \textbackslash{}
--api-key=your-api-key
Validate your rules
To check the structure and schema of your YAML detection files:
- Validate a single file:
scanner-cli validate -f detections/okta-password-spray.yaml- Validate a directory of rules (only one level deep):
scanner-cli validate -d detections/- Recursively validate subdirectories:
scanner-cli validate -d detections/ -rRun local unit tests
Use run-tests to execute the tests: block in your detection YAML:
- Test a single file:
scanner-cli run-tests -f detections/okta-password-spray.yaml- Test a directory:
scanner-cli run-tests -d detections/- Run recursively:
scanner-cli run-tests -d detections/ -rTests are evaluated based on whether synthetic or real log data triggers the detection, given a now_timestamp, time_range_s, and run_frequency_s. You’ll see detailed output if a test fails like whether no events matched your filter, or whether the time window didn’t include the logs.
Combining GitHub rule sync with the Scanner CLI, your team can confidently version, test, and ship detection logic using CI/CD practices with no manual UI work required.
Bootstrapping with open-source detection rule packs
Getting started with strong detections doesn’t mean starting from scratch. Scanner provides a high-quality set of open-source detection rules for Okta, available at scanner-inc/detection-rules-okta on GitHub.
This repository contains multiple production-ready rules written in Scanner’s YAML format, each designed to identify suspicious or high-risk identity-related activity across your Okta logs. These detections can be directly imported into your Scanner GitHub sync setup or used as-is to protect your environment on day one.
What’s in the Okta detection rule pack?
The rule set includes rich coverage across multiple MITRE ATT&CK tactics and techniques, with a focus on real-world threats and identity security posture. Here’s a high-level summary of the types of attacks it helps you catch:
Privilege Escalation & Account Manipulation
- “Okta Admin Role Assignment Created” and “Okta Administrator Role Assigned to User” detect unexpected changes to privileged access.
- These detections help monitor for insider threats, misconfigurations, or post-exploitation privilege abuse.
Credential & Token Abuse
- Flag suspicious creation, enablement, or revocation of API tokens, including “Okta API Token Created” and “Okta API Token Revoked”.
- Watch for changes to MFA status, with detections like “Okta MFA Reset or Deactivated” and “Okta MFA Bypass Attempted”.
Persistence & Defense Evasion
- Detections cover creation or modification of identity providers, sign-on policies, network zones, and application settings all of which can be abused to persist access or impair defenses.
- Examples include “Okta Identity Provider Created” and “Okta Policy Modified or Deleted”.
Initial Access & Phishing
- A standout rule, “Okta FastPass Phishing Detection”, highlights phishing attempts blocked by FastPass.
- These rules are extremely valuable in surfacing attacker infrastructure (IP addresses, domains, etc.) that you can investigate further using Scanner’s cross-log search.
Reconnaissance & App Discovery
- “Okta User Attempted to Access Unauthorized App” helps detect attackers probing for available services or misconfigured access controls.
User-reported Threat Signals
- “Okta Suspicious Activity Reported by End-user” taps into human sensors to bubble up suspicious activity early.
How to use the detection rule pack
You can:
- Clone the repo and include selected rules in your own GitHub-synced detections folder.
- Use the Scanner CLI to validate, test, and deploy rules.
- Copy-paste the queries from the YAML into the Scanner UI under Detections > New > Create New Rule for rapid evaluation.
- Use it as a model for writing your own detections by example.
This gives you a head start on identity threat detection, especially in high-trust environments where Okta acts as the core identity provider. It’s especially useful for teams bootstrapping detections in new cloud-first or hybrid orgs where Okta events can act as a primary early-warning system.
You can view the Okta detection rule pack here: github.com/scanner-inc/detection-rules-okta.
Key takeaways
This guide walks through a modern pipeline for monitoring and detecting security threats in Okta logs using open-source tools. Here are the essential lessons:
Grove collects and normalizes Okta logs at scale via API, stores them in S3, and runs on AWS ECS (Fargate). Terraform templates make deployment easy.
Substation enriches raw events geo-IP, ASN info, CSV lookups, HTTP GET responses, and more. Enriched logs are routed back to S3.
Scanner indexes the enriched data directly from S3, enabling both ad hoc search and continuous threat detection with YAML-based rules. Detection alerts can be sent to destinations like Tines, Torq, Slack, or PagerDuty.
Scanner Search: Example Investigations
- Detecting users logging in from multiple countries within 6 hours
- Detecting password spray attempts by IP
- Catching FastPass-declined phishing attempts
Real-time detection with roll-up trees: Scanner runs all detection queries once per minute using a roll-up tree structure stored in S3.
Open-source detection rules for Okta: You can start quickly with 20+ production-ready rules from our GitHub repo.
GitHub sync and staging workflows
A recommended workflow:
- Run searches to find detection-worthy patterns
- Create the rule in the UI, pointing alerts to a staging event sink
- Once vetted, promote to your GitHub repo for production
Rules are versioned, testable, and manageable as code.
Okta logs are one of the richest sources of security signals. By combining Grove for collection, Substation for enrichment, and Scanner for real-time detection, teams can treat identity telemetry like first-class data: structured, actionable, and continuously monitored.
Where to go from here
We hope to give folks a playbook for quickly building an import pipeline and establishing threat monitoring for one of the critical systems that attackers target first: Okta identity.
We recommend checking out Grove and Substation for building an import pipeline. Also, feel free to use our open-source detection rules for inspiration, or sign up to test Scanner’s search and detection features on your Okta logs.