Introducing New Statistical Aggregations: Average, Percentile, Variance, and More
We’re excited to announce the release of new statistical aggregation functions in Scanner’s query language, which helps you explore your logs in powerful ways.
Introducing stats queries
Scanner supports a new stats query feature, which gives you the ability to compute statistical aggregations.
* | stats <functors> by col1, col2, ...For example, let’s say you would like to know if any employees are querying your company’s S3 buckets at high levels. This could indicate that an employee’s user identity has been compromised and is being used to steal data from S3.
Here is a stats query in Scanner that retrieves all of the S3 requests made by employee IAM user identities and then compute the average, median, and 90th percentile of request counts by user.
userIdentity.type: "IAMUser" and eventSource: "s3.amazonaws.com"
| stats count() as numReqs, userIdentity.arn by userIdentity.arn
| stats avg(numReqs), percentile(50, numReqs),
  percentile(90, numReqs)
Users in the 90th percentile might be suspect, so you can then drill down into the activity of these users and check for malicious behavior.
userIdentity.type: "IAMUser" and eventSource: "s3.amazonaws.com"
| stats count() as numReqs, userIdentity.arn by userIdentity.arn
| where numReqs >= 158
New visualizations
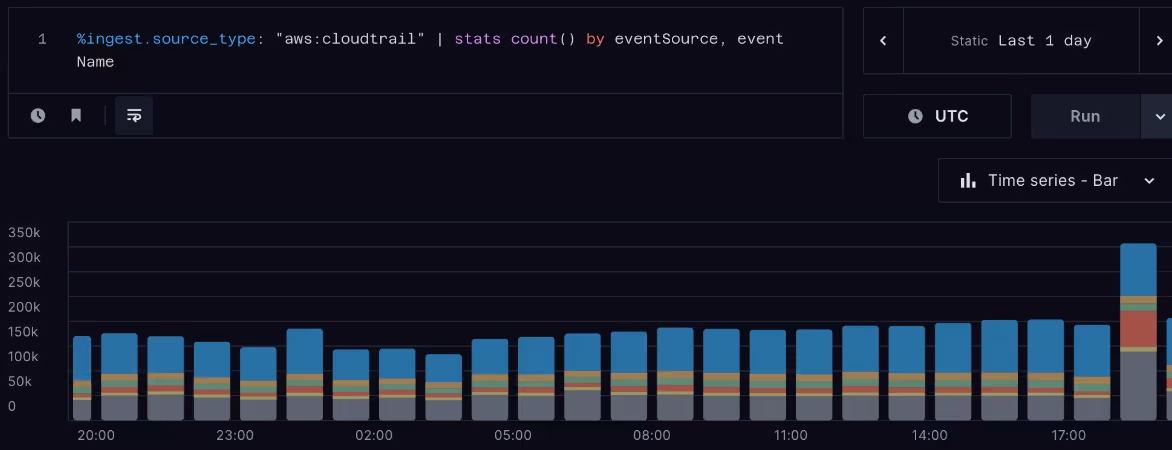
When you execute a stats query, Scanner allows you to visualize the results in a few ways. You can view a simple bar chart that demonstrates the total aggregation breakdown, or you can view time-binned bar charts and line charts that display how the aggregations have evolved over time.
Statistical functions available with stats
When you use the stats query feature, there are several statistical functions you can use to explore your data.
count()– compute the total count of hits per groupcountdistinct(col, ...)– compute the distinct number of values in a columnavg(col)– compute the average of a numeric column across all groupsvar(col)– compute the sample variance of a numeric columnpercentile(n, col)– compute the n-th percentile of a columnsum(col)– compute the sum of a numeric columnmin(col)– compute the minimum value of a columnmax(col)– compute the minimum value of a column
Powerful, fast data exploration
We want queries to be fast so that investigations can be performed as quickly as possible, and this includes stats queries. When result sets get large, Scanner uses probabilistic algorithms and data structures to produce approximate answers with low error. For more details, check out our docs: https://docs.scanner.dev/scanner/using-scanner/aggregations.
Now that these statistical query functions are in place, we are building several cool features on top of them. Stay tuned!